📈 From Routine to Insight: Turning Calendar Data into a Habit Tracking Dashboard
A personal analytics pipeline that turns calendar data into weekly habit insights and behavior patterns — helping align time with values, goals, and long-term growth.
July 8, 2025 | 6 min read

PROJECT OVERVIEW
I've spent countless hours every week decoding my calendar, just to figure out where the time went. So I built a habit tracking pipeline that turns those data blocks into instant metrics—completion rates, blocker trends, and a score illustrating alignment with my goals and values.
In this post, I will be sharing the build (Google Calendar → MongoDB → MySQL), the dashboards (Tableau) it powers, and the lessons I've learned while turning daily life-logs into automated actionable feedback.
🌄 The Journey
Life is a series of hills and valleys — and if left to its own devices, those patterns can derail our path.
Over the years, I've become more focused on designing ways to understand and improve my behavior through life experiences and daily habits.
This led me to a personal necessity to plan, track, and reflect on how my time was spent by using my Google Calendar to structure my day to day life with an agile methodology in mind — planning each month with a core problem to solve, each week with a focused theme, and each day around intentional tasks and supportive rituals.
THE PROBLEM: Manual Reflection Wasn't Sustainable 😣
Weekly check-ins became labor-intensive and inconsistent. I also couldn't shake the feeling that my calendar could serve as a data source for habit insights on behavioral patterns and make data-driven decisions.
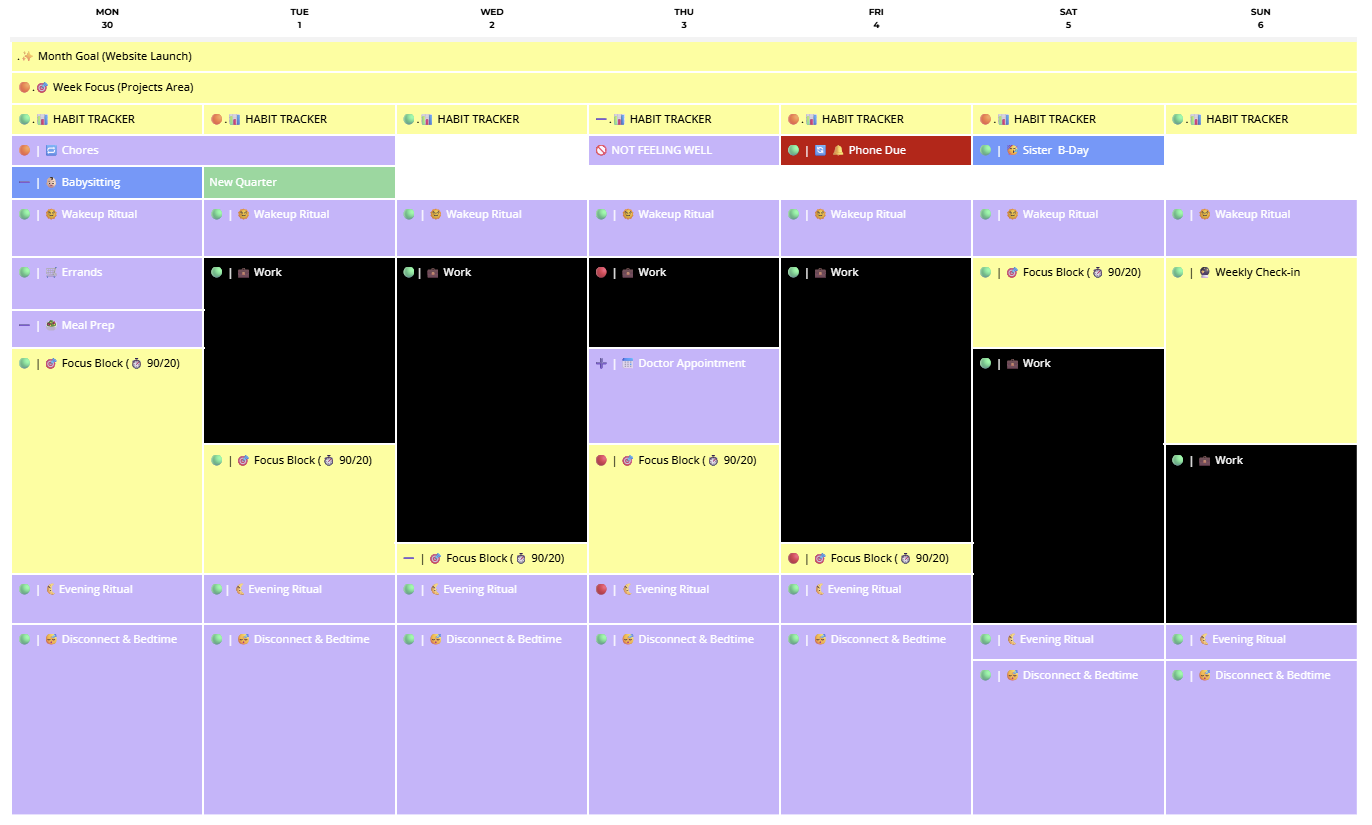
My calendar already tracks everything: daily focus blocks, rituals, habit markers, and tasks organized by weekly themes and monthly goals. Also, a weekly check-in involving a multi-step audit that looks like the following:
- Skimming through each day to track what I actually completed
- Comparing planned activities vs. missed ones
- Reflecting on what blocked me, or where I lost focus
- Trying to extract insights that could shape next week's focus and monthly goal alignment
But my system only worked when life was stable. If I missed a week or two, the backlog would grow, and I'd lose visibility into behavioral patterns. I needed a repeatable way to:
- Extract structured, accurate data from my calendar
- Automate habit tracking and completion metrics
- Identify patterns and blockers with minimal effort
- Support planning with evidence, not memory or visual observation
😌 THE SOLUTION: Data Insights using Habit Tracking Dashboard
I built an ETL pipeline using Python, Google Calendar API, MongoDB, and MySQL to support habit tracking, weekly reflection, and long-term analysis in Tableau.
The data flows end-to-end as follows:
Extract → Stage → Transform → Load → Analyze/Visualize
- Authenticate and connect to the Google Calendar API
- Extract calendar events by name and within a defined timeframe
- Stage raw data in MongoDB for inspection and data preparation
- Transform events into clean structured activity records
- Load activity records into MySQL for querying and analysis
- Analyze or visualize data using Python, SQL, and Tableau
I wanted to turn my weekly rituals into something more scalable and data-driven — a data pipeline that could transform routine into repeatable insight.
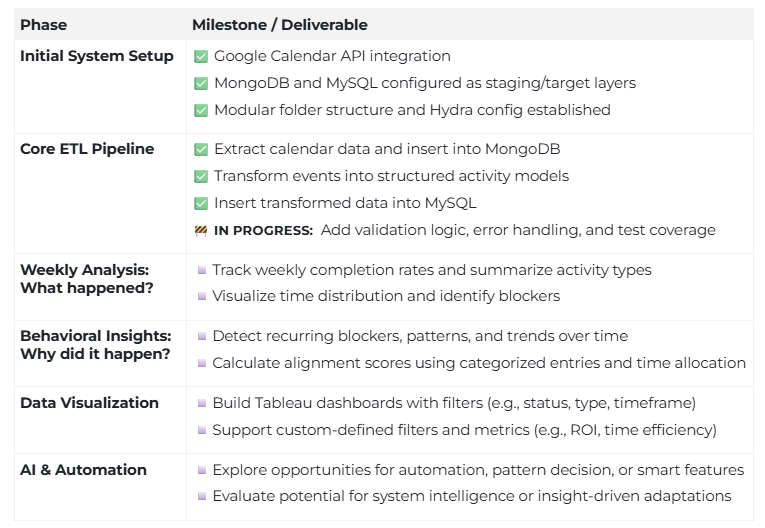
🧭 PROJECT ROADMAP: Ongoing Progress
Below outlines how the Habit Tracking Dashboard project has progressed and where it's headed.
FROM DATA TO VISUALIZATION
Turning behavior into insight takes more than collecting data — it requires designing systems that can clean, organize, analyze, and visualize everyday patterns in meaningful ways.
🛠 Behind the Build
The ETL pipeline is organized into modular components to follow a clear separation of concerns so that the system is easier to maintain, scale, and reason with. This separation gives me flexibility during development, while MySQL serves as the clean, structured destination for analysis and future data visualization.
💻 Tech Stack
-
Google Calendar API
Primary source of habit and task data, extracted as event records -
Python
Core language used to build the ETL pipeline -
MongoDB
Non-relational (NoSQL) database for staging raw data to support inspection and data preparation -
MySQL
Relational (SQL) database for cleaned and transformed records -
Hydra
Configuration management for credentials and application settings -
Custom Logging Context
Logging for traceable pipeline runs and debugging -
Tableau
Visualization for dashboards
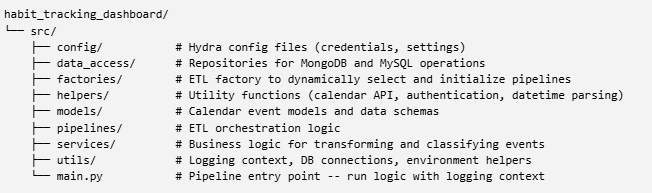
🗂️ Project Structure
🧩 Design Principles
From the beginning, this project followed an agile, exploratory approach. I knew I wanted to analyze habit consistency and behavioural patterns, but I didn't want to over-engineer a solution before the end goal was fully clear.
To avoid that trap, I designed the pipeline around three principles:
- Staging before structuring – Raw data is first stored in MongoDB to allow inspection, flexibility, and iteration before enforcing structure
- Modularity and maintainability – Each part of the data flow (extraction, transformation, loading) lives in its own service or repository, making it easier to update or test in isolation
- Scalability – Support future pipelines, data sources, and data analysis/visualization
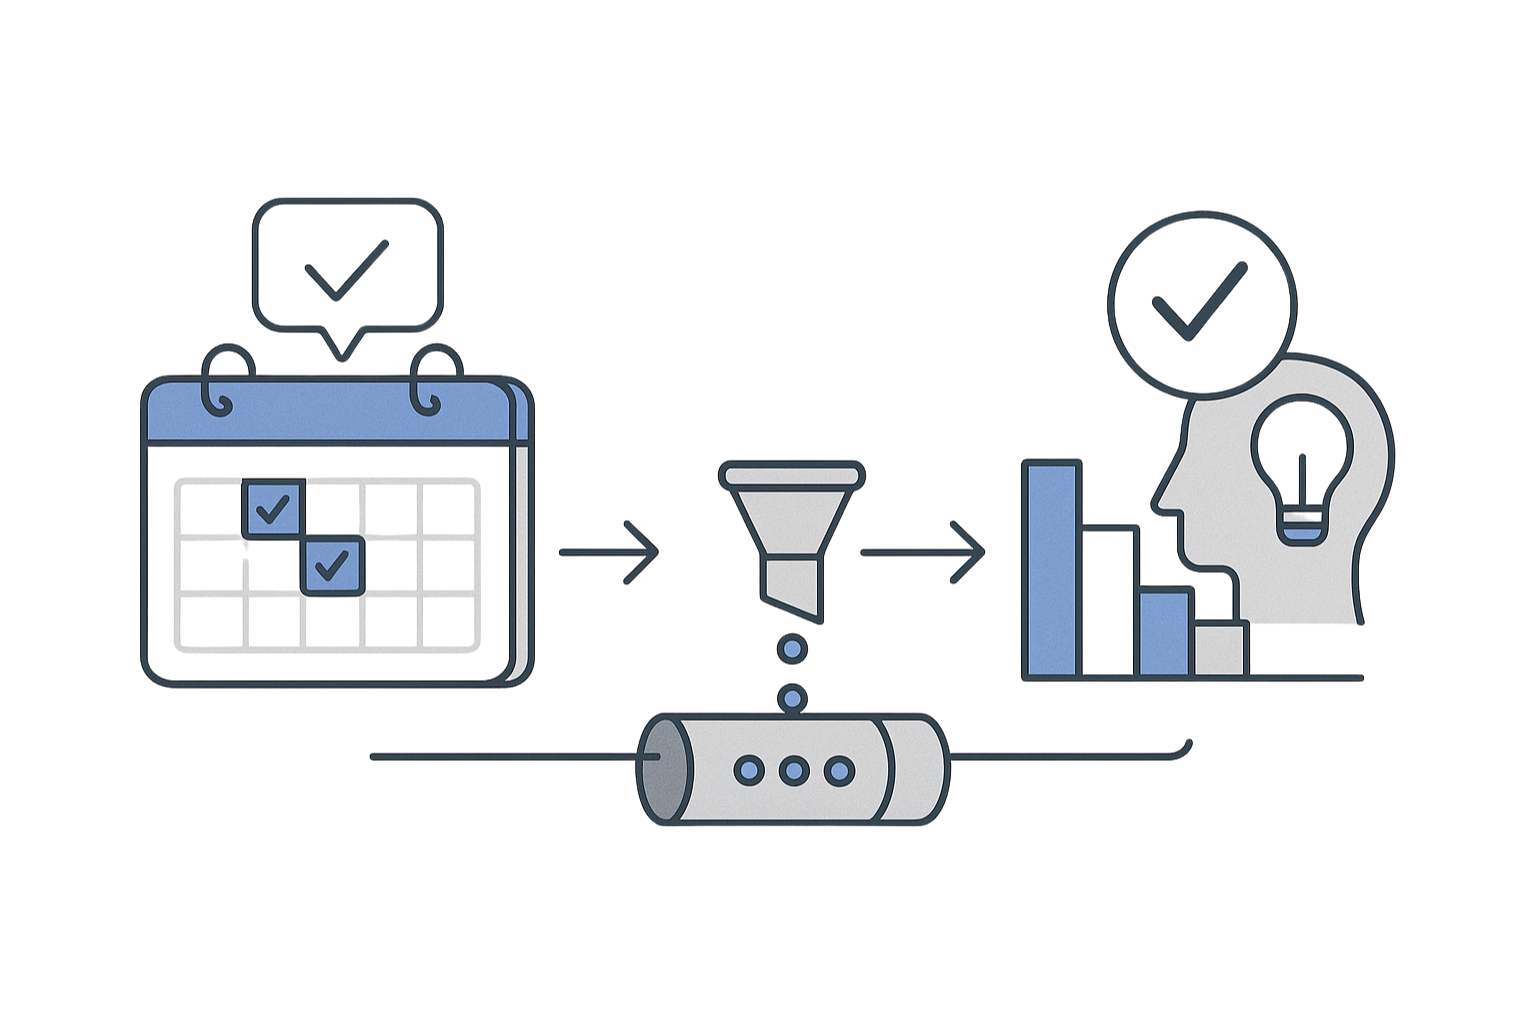
⚙️ ETL Pipeline in Action
The system is programmatically executed through the following service calls:
-
Extract calendar data using Google Calendar API and store the full JSON payload in MongoDB extracted collection using the StagingRepository
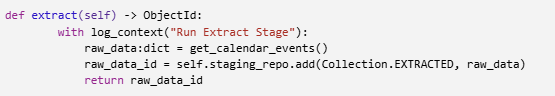
Illustration by Sarlin Tejada -
Transform calendar events into Activity objects and save them in MongoDB transformed collection for downstream loading using StagingRepository
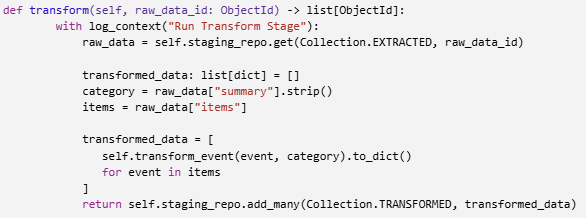
Illustration by Sarlin Tejada -
Load transformed Activity records from MongoDB staging collection into MySQL tables using the TargetRepository to support downstream querying and visualization
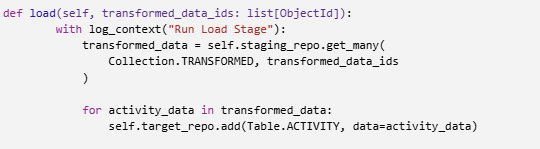
Illustration by Sarlin Tejada
Making Sense of the Patterns 😵💫
Once the calendar data is transformed and stored in MySQL, it serves as the foundation for weekly analysis, and long-term behavior insights in order to surface trends, track consistency, and uncover blockers — all in service of aligning how time is spent with what matters most.
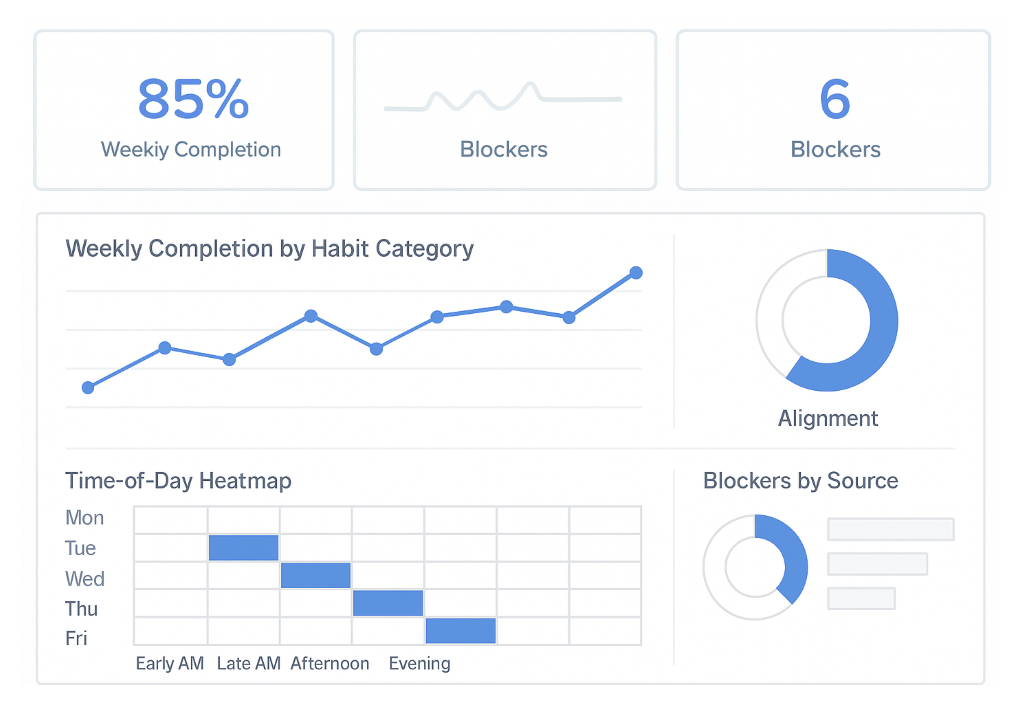
📊 Weekly Analysis – What Happened?
This analysis is guided by a descriptive analysis approach that highlights what actually happened over the week by tracking weekly completion rates, identifying blockers, and enabling time distribution visualization by addressing key questions like the following:
- What went well? What didn't? Planned vs. Completed Activities
- How time was distributed across key activity types (e.g., Self Care, Focus Block, Learn & Grow)?
- Which activities were skipped, blocked, or repeated?
📈 Behavioral Insights – Why Did It Happen?
This analysis is guided by a diagnostic analysis approach that supports value alignment, energy optimization, and proactive planning in the weekly plan ahead ritual. It helps translate data into better decisions for the upcoming week by focusing on uncovering patterns related to the following:
- What habits showed consistency or fluctuation?
- Are there recurring friction points or blockers that need attention?
- Are certain habits more successful at specific times of day or week?
- Is there a growing gap between stated values and actual behavior?
- Where can time be reallocated for greater alignment or effectiveness?
By surfacing long-term behavioral patterns, this step helps ensure each week is informed by the previous one — evolving over time with purpose and clarity.
Tell the Story Visually 🤩
Together, these approaches transform data into meaningful feedback that frames data insights for visualization in the form of operational and strategic Tableau dashboards that inform and tell a story related to the following:
- Weekly completion rates by habit category and status
- Time distribution across time of day and activity types
- Blocker trends showing recurring sources of friction
- Alignment scores comparing time spent with personal goals and values
• • •
What I've Learned So Far 💭
While the data analysis and visualization layers aren't complete yet, the system is already surfacing meaningful cues.
I've started noticing patterns in focus breakdowns, identified routines that tend to slip, and noticed how certain activities cause a consistent fall-off in rhythm. These early signals are already helping me adjust with more awareness — and once the dashboards are in place, I expect the insights to run even deeper.